Tag Archives: generative art

Hydra Tutorial For Live Coding Visuals

In my last post I wrote about the first session of SpacyCloud’s Live Twitch stream from two weeks ago. The twitch stream was an all day event where the first half of the day consisted of a variety of workshops around creative coding topics, while the second half featured performances from various audio visualization artists and creative coders. Unfortunately I could not attend all the events, but I wanted to write in detail about both the Hydra event and P5JS event. You can read the P5JS post here. Now let’s dive into some live coding visuals!

The Hydra tutorial on SpacyCloud was taught by Zach Krall, a graduate student at Parsons School of Design with an impressive portfolio of projects. Though I had been experimenting with creative coding since college and knew about Processing, the language that P5JS was ported from, I had never heard of Hydra before. Just the fact that it was something new peaked my interest, but when I saw the home page for the Hydra-editor I was pretty much sold. Every time you load Hydra, a different visualization appears on the screen, with the code that wrote to make it overlaid on top. You can copy and paste the code, so in a way each new visualization is like its own mini tutorial.
Zach Krall’s personal website

It turns out that all of the coding for Hydra happens in the browser, and the background of the entire browser window changes to display the product of your code. Personally I prefer this over the two panel system that most web coding editors use, because when it comes to visualizations you want to be able to see them in as large a display as possible. However I could see some people not liking this, because the code is a bit harder to read, even though it does have a background color applied.

Hydra was created by Olivia Jack who wanted to build a visualization engine that took its inspiration from analog televisions. It did that and a lot more, because with Hydra you can connect to other machines and each output your own video stream that can then be modified by others.

Probably the hardest thing about starting out with Hydra is wrapping your head around some of the paradigms, which are pretty different from your typical application. In Hydra, you typically start with a basic visual preset or texture, like noise, voronoi, or oscillation. Check out these basic visuals below. Note that while these screenshots are static, within Hydra all of these are moving visualizations.
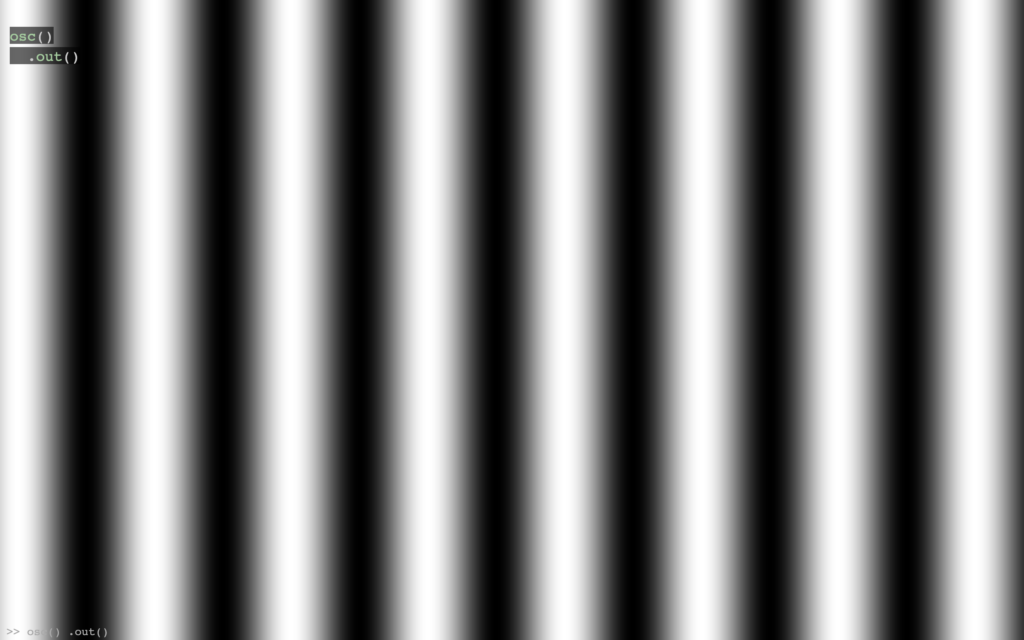
A basic oscillation visualization is drawn to the browser with osc()
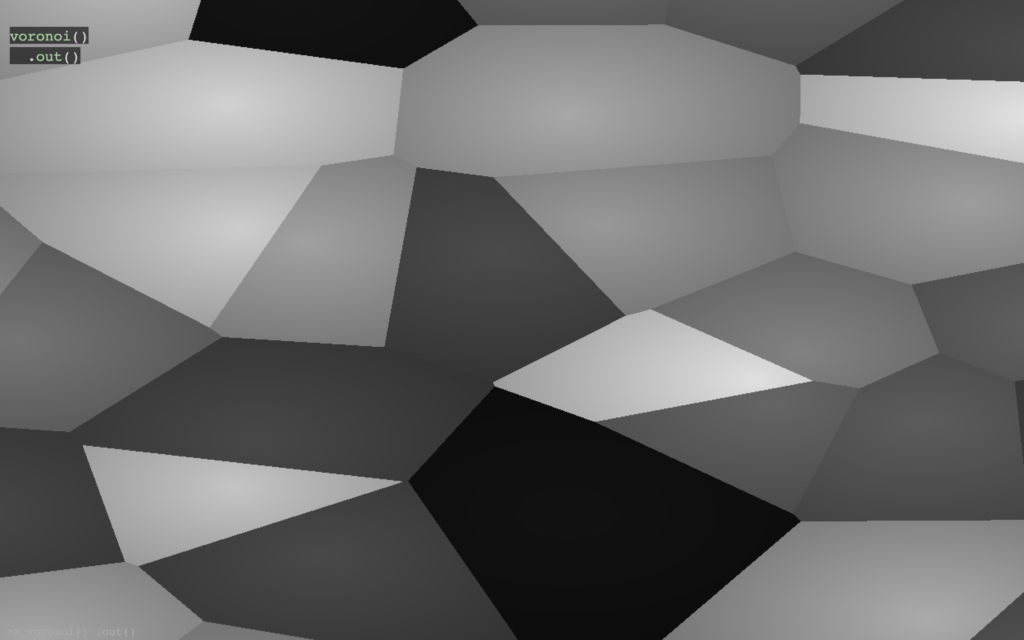
A basic voronoi visualization is drawn to the browser with voronoi()
A basic noise visualization is drawn to the browser with noise()

You can also pass values into the function to change it. For example, if I write noise(100) instead of just noise() the gray matter gets much smaller, like specks of dust rather than blobs. If you pass noise(100, 100) the specks of dust will start moving around the screen MUCH more quickly. The same can be said for voronoi and oscillation. First number defines the density of shapes, the second defines the speed of movement. Be careful passing in large numbers for the speed, it can be quite painful on the eyeballs.
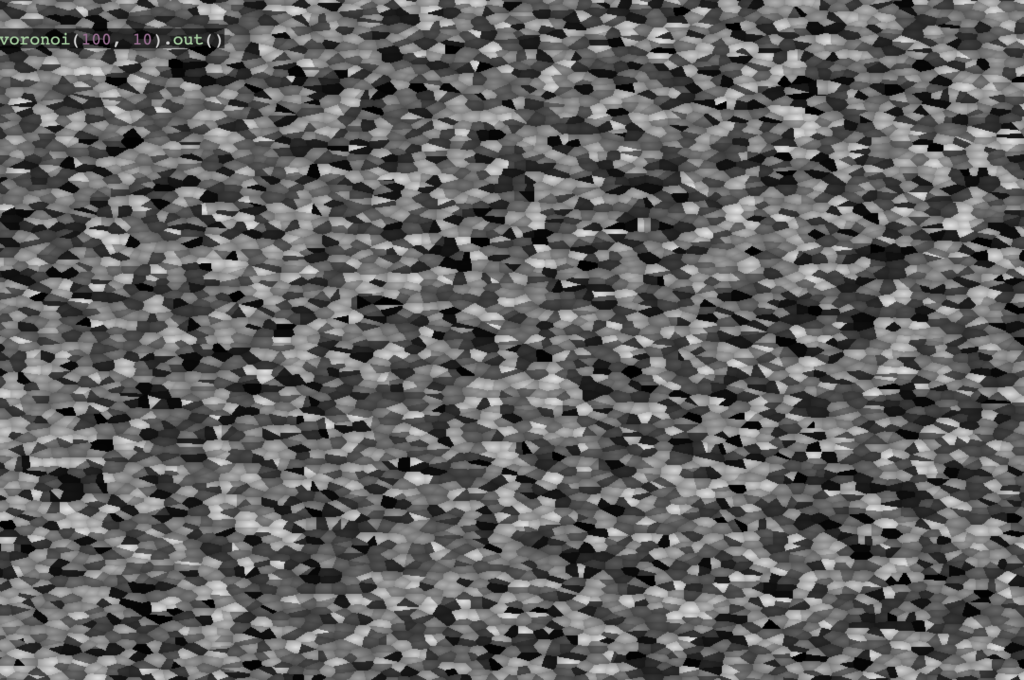
In order to execute the code you need to hit Shift + Ctrl + Enter on the keyboard. You might have noticed the code inside the screenshots include a second function chained on called out() . This function is basically telling the browser to output everything in front of it in the chain. If you remove out() nothing will render to the browser and you will only see a black page.

We’ve covered voronoi, noise, and oscillation. There’s one more basic render and that is shape(). Drawing a shape in Hydra is simple enough. The number you pass into the shape() function defines the number of sides for the polygon. So, shape(3) is a triangle while shape(4) is a rectangle, and so on.
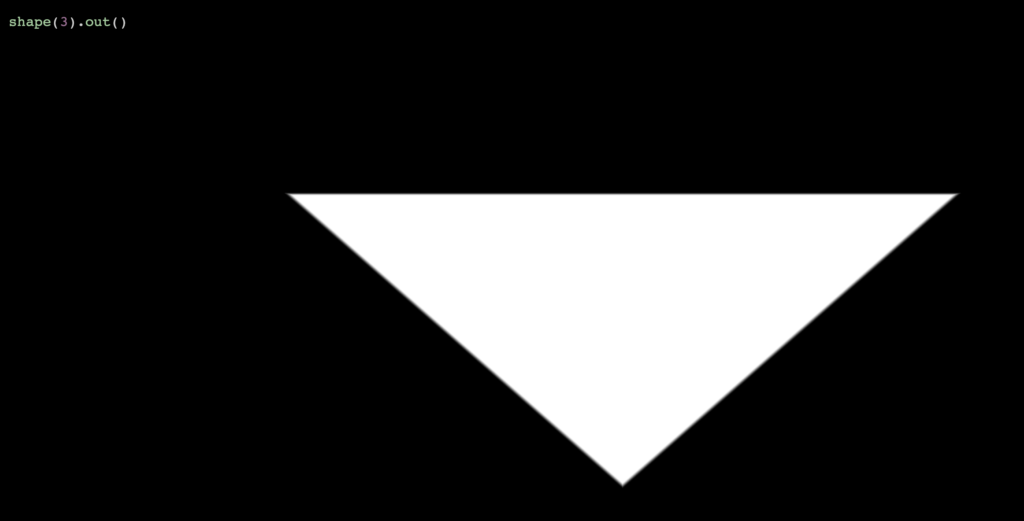
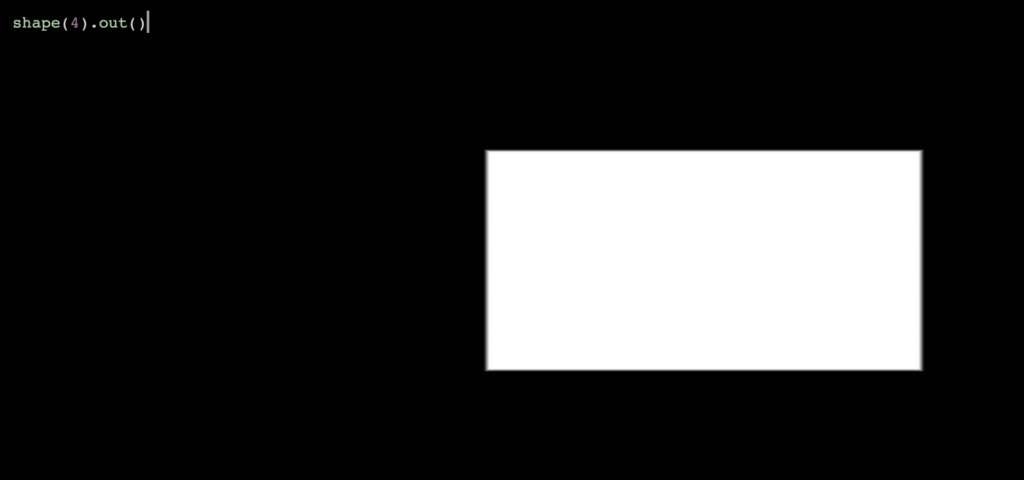
You can also specify how large each shape is and how blurred its edges are by passing in 2 more numbers into the function.
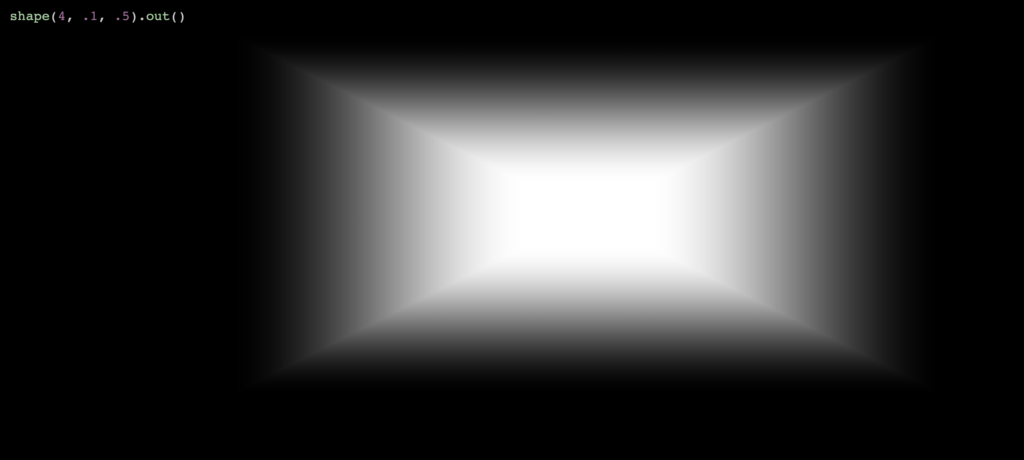
You might be wondering, what could one possibly do with a simple shape in the middle of the screen? That is hardly interesting to look at. I also thought it was a little bit odd that you couldn’t place multiple shapes or define that border and size of the shape like you can do in most creative coding languages. However, I was pleasantly surprised after some experimenting, as hopefully you will be too.

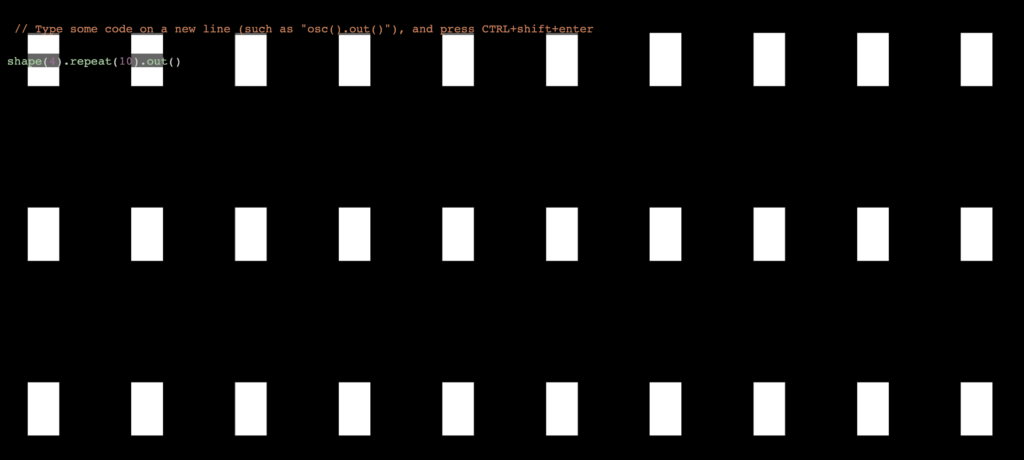
One of the easiest things to do is create a tile pattern with the shape. You can do this by chaining a repeat() function, where the numbers you pass into the function define how many times the shape is repeated.

If you write repeat(10,10) like in the screenshot above, you get the shape repeating ten times both in the vertical and horizontal directions. If you write repeat(10) then you will have the shape repeat ten times in the horizontal direction, but not vertical. This function is one of the geometry functions, which you can read more about in the documentation.
So how might you apply color to these shapes? If you were using voronoi, noise, or the other automatically generated textures, its very easy. You just chain a color() function where you pass 3 values corresponding to the amount of red, green, and blue.
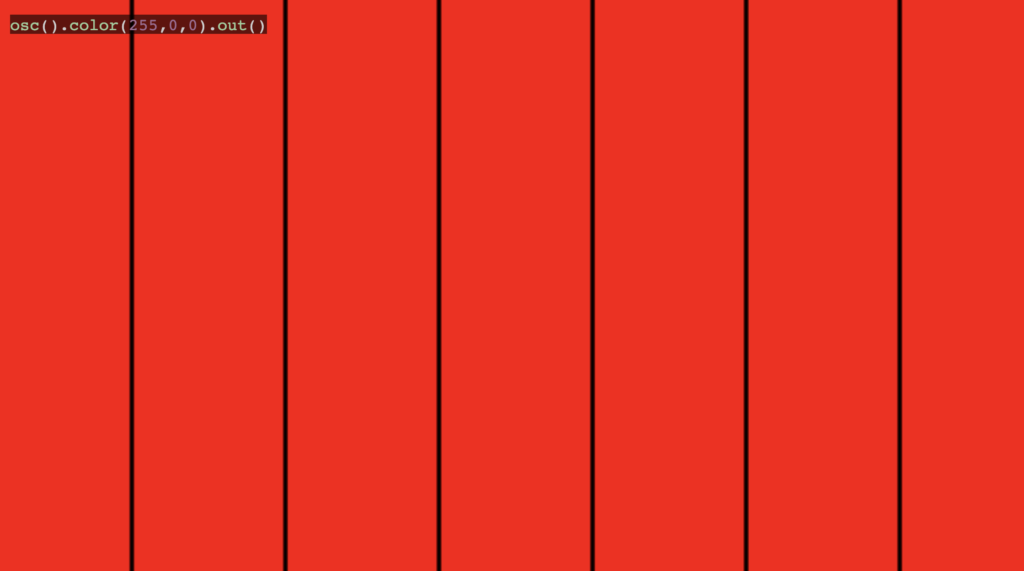
A pure red oscillating texture

Because you cannot apply color directly to a shape, the workaround is to use a blending function with shape() and applying color within the blending function. For example, you can blend the red oscillator above with the rectangular tiles in the other screenshot.

Now you can see the rectangles are overlaid on top of the oscillating red texture. There are multiple blending functions, and each one has a different effect. I won’t go into detail on all of them because this post is getting lengthy and I am wary of the cognitive burden,

Suffice it to say there are 6 blending functions in total, called operators in the documentation. The other 5 are add, diff, layer, mask, and mult. If you’ve ever experimented with layer effects in Photoshop, some of these should sound familiar. Depending on the complexity of your visualization, these operators will sometimes output the same result. You are most likely to notice differences when using a range of color and texture.

Let’s take the our oscillator and jazz it up a bit. Rather than using the color() function to apply a simple red color, you can actually pass 3 values into the osc() function directly. The first still specifies the number of oscillating rows, while the second specifies the speed they move across the screen, and the third specifies the range of color. Lets say we use the diff() operator and also tweak our rectangles by making them a bit larger and blurrier. What might that look like?
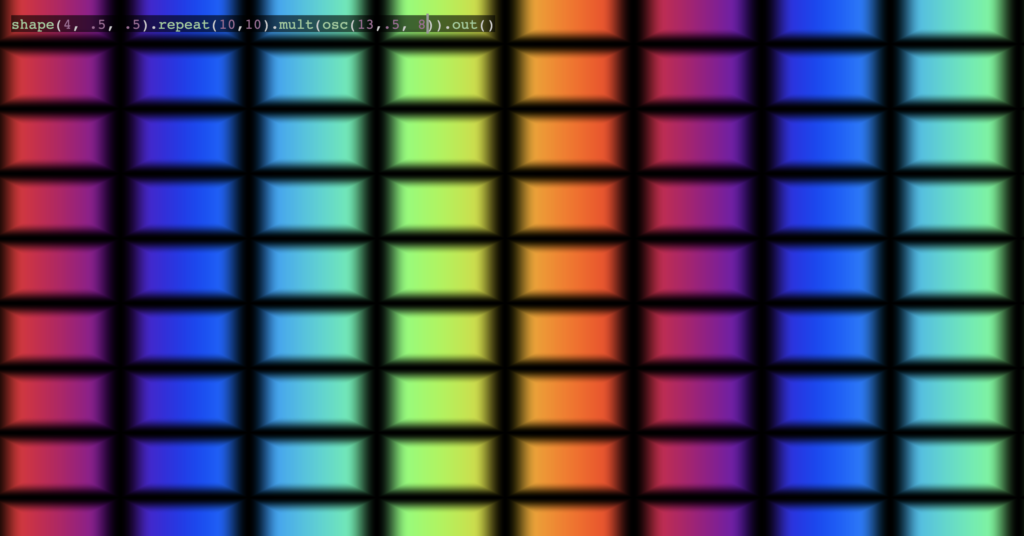
Now we’re cooking with gas. Just a few extra functions and things are much more interesting. There are many variables we can tweak to experiment even with this relatively simple visualization. For example, what happens if we change the oscillator to a voronoi or a noise generator?
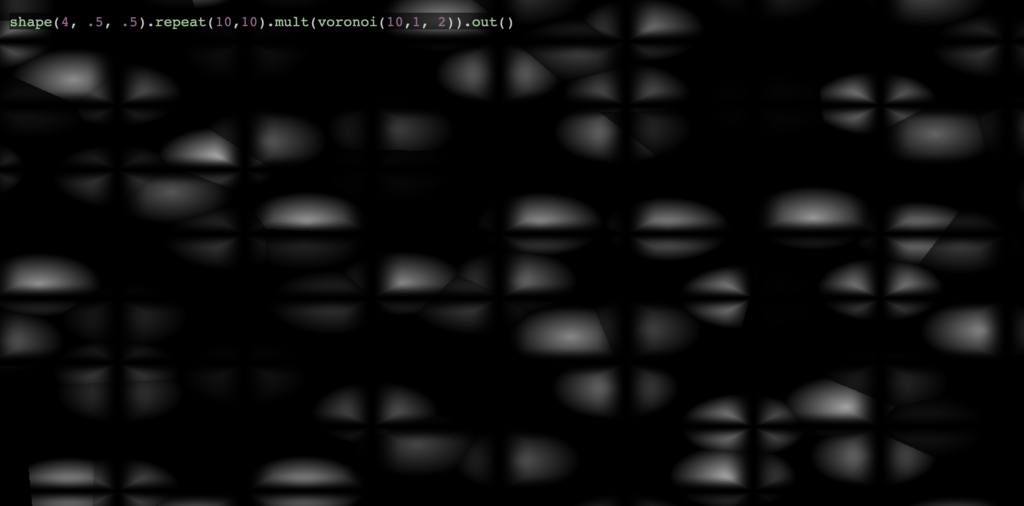
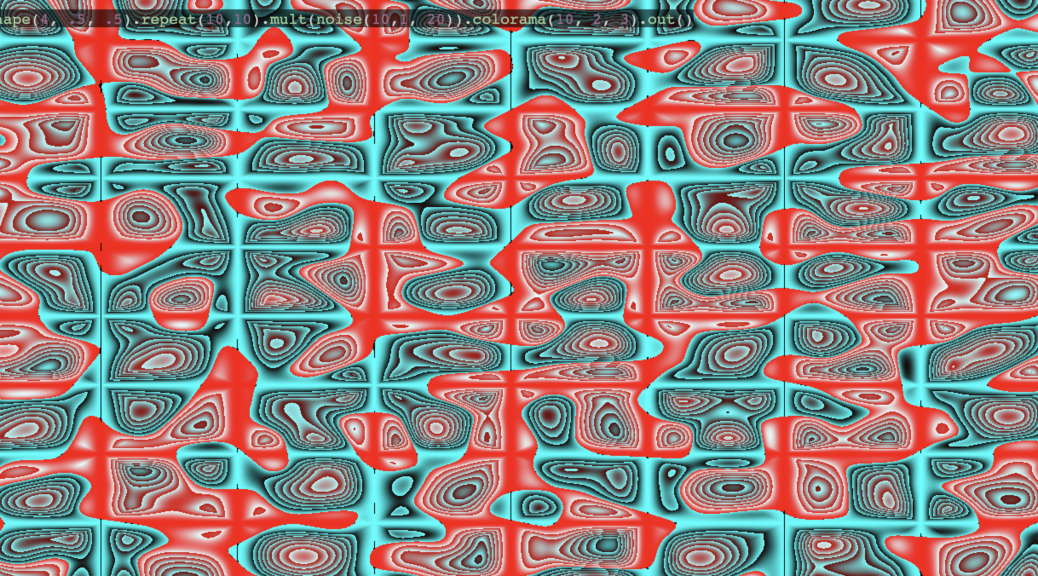
Alright, so it looks like we lost the cool colors but got a more interesting texture in return. Are there other ways to bring back color besides the ones I showed? Absolutely! The colorama() function which brings all sorts of psychedelic fun. It’s the last function I wanted to demonstrate because it can spice up pretty much any visualization, and is probably the quickest to get interesting results with.

live coding visual with shape function blended with colorama and voronoi

I hope by now you have the hydra-editor open in several tabs and have virtually lost interest in this post because you are too busy experimenting. Hydra is seriously one of the most absorbing and exciting creative coding tools I’ve had the pleasure of working with, and the goal of this post was to give you enough knowledge that you can hit the ground running.

Of course there is tons of material I couldn’t cover, and for that I want to leave you with a few references.

Hydra book is a very detailed guide that goes into pretty much every function Hydra has to offer, with lots of screenshots to help you along the way: https://naotohieda.com/blog/hydra-book/

Olivia Jack’s documentation is also nothing to shake a stick at, and has lots of coding examples that you can copy and paste to experiment with. There are also more Hydra tutorials listed here: https://github.com/ojack/hydra#Getting-Started

The Github repo includes a section with a whole list of resources which you can check out here: https://github.com/ojack/hydra/blob/master/examples/README.md

If its community you’re craving Hydra also has a facebook group with over 500 members: https://www.facebook.com/groups/1084288351771117

I hope you enjoyed getting your feet wet with live coding visuals. Good luck and happy creative coding!

If you enjoyed this article, consider following me on Twitter @nadyaprimak or if you need more tips on breaking into the tech industry, you can read my book “Foot in the Door”.
P5.js Tutorial for Beginners

I had the immense pleasure of attending several creative coding workshops on April 4th. They were streamed live on the SpacyCloud Twitch channel. There were additional sessions involving Hydra, Raspberry Pi, Haskell, and more. However for this post I want to focus on the first session which was a P5.js tutorial. In this post I hope to translate the P5.js tutorial for beginners into a written format, for posterity and to share what I learned. I’m going to review what was taught in the live session. Hopefully SpacyCloud will have another live stream in the future so I can catch up on what I missed. Here is the landing page for the event schedule.

Although I have used Processing years ago when I was in college, I knew I was very rusty which is why I decided to tune into Leandra T’s P5.js tutorial stream. Originally branded as a creative coding language for artists, Processing is mainly used to create generative art, visualizations, and immersive installations. P5.js is basically a version of Processing that is ported to Javascript. Processing was developed my MIT and is built on top of Python. Naturally people wanted to be able to show their generative art online, so it didn’t take long for there to be a huge demand for Processing that worked with Javascript instead of Python. Since P5.js has taken off there is tons of code online that people are sharing, making it a lot easier to learn.

That being said, it’s still nice to have someone walk through every step with you. That is what Leandra did. After showing us an example of what we were going to make, Leandra dived right into the online P5 editor. Whats great about this editor is you can do all of your coding online and see the results of your code side by side. She went over some of the basic functions, such as setting the canvas and background, and drawing shapes.

In the above code (to be more precise, a screenshot from the aforementioned P5 editor) you can see two functions, setup and draw. The setup function is called once when the application first runs, while draw is called constantly every frame (at least 24 times per second). What that means is that while it looks like the circle is static, it’s actually being redrawn constantly. However our eye cannot perceive that so it looks as though the circle is always there.

As you might have guessed, createCanvas is only called once and the two numbers you pass are the pixel width and height of the canvas, respectively. The canvas defines the area within which you can draw. Inside the draw function, background is what defines the background color of your canvas. If you pass 1 number, you will get a shade of gray as if you passed 3 RGB (red, green, blue) values. That means that background(220) is just shorthand for background(220,220,220). Each value can be as high as 255 (white) or as low as 0 (black).

Then of course you have the ellipse. In the screenshot above there are only 3 values passed to the ellipse function: x coordinate, y coordinate, and radius. However, you can actually pass in 4 values, which is why the function is called ellipse rather than circle. Passing in 4 values means you can stretch or squish the shape because you are passing the x coordinate, y coordinate, width, and height.

So far this is pretty boring. Luckily, it only takes a few tweaks for things to get a lot more interesting. Instead of passing the ellipse static values you can pass in things like mouseX, mouseY, or random. Passing in mouseX to the first value of ellipse and mouseY to the second value will make it so that you are essentially painting circles across the canvas wherever you move your mouse, because the ellipse will follow your cursor. If you pass random instead, the computer will generate a random number every frame and draw the ellipse to those coordinates.

You need to at least pass random a maximum number, so that it knows the range within which the random number can fall. If you want circles to cover the whole canvas, you can use random(width) for the x coordinate and random(height) for the y coordinate because P5.js stores the width and height of the canvas to those variables. Also make sure you move background out of the draw function and into setup, otherwise you will only ever see 1 circle on the canvas because the background will continuously be drawn on top of it.

What the canvas will resemble when you pass in random(width) and random(height)
Using mouseX and mouseY will be more like “painting” with the shape

Okay so now we’ve got lots of shapes on the canvas, but where is the COLOR?! Much like you can provide the background 3 values that reflect red, green, and blue you can do the same for shapes with the fill function. For example, if I pass fill(255, 0, 0) I will get a completely red circle like below.

But what if I pass random values instead? What do you think will happen?

Now we’re cooking with gas. Leandra went through similar steps in her live tutorial, to make sure everyone understood the basic principles and the most commonly used functions in P5.js. One of the most popular uses is to create visualizations that respond to sound. These are obviously a huge thing at raves and concerts, and they are easy and fun to make. The first step is to make sure you have the sound library linked in your P5.js editor.

On line 5 in the above screenshot there is a url pointing to p5.sound.min which is the P5.js sound library. If you click the little arrow above the code it expands to view the files that you see on the left hand side. Click on index.html and confirm that you also have the p5.sound.min script on line 5.

The next screenshot illustrates the additional code you will need in order to setup the mic and start receiving data from it that you can use for your visualization. Basically, you have to setup some variables at the top so that you can access your mic anywhere in the code. The variables start off empty but then you pass the actual mic in your setup function and start it so that it actually runs. Finally, you need to get useful data from the mic so you call getLevel to get the loudness which you can use for visualizations. You can confirm that the mic is working by adding a console.log statement so you should see values being returned below your code when you run it.

I know that my mic is working because I am seeing values in my console at the bottom

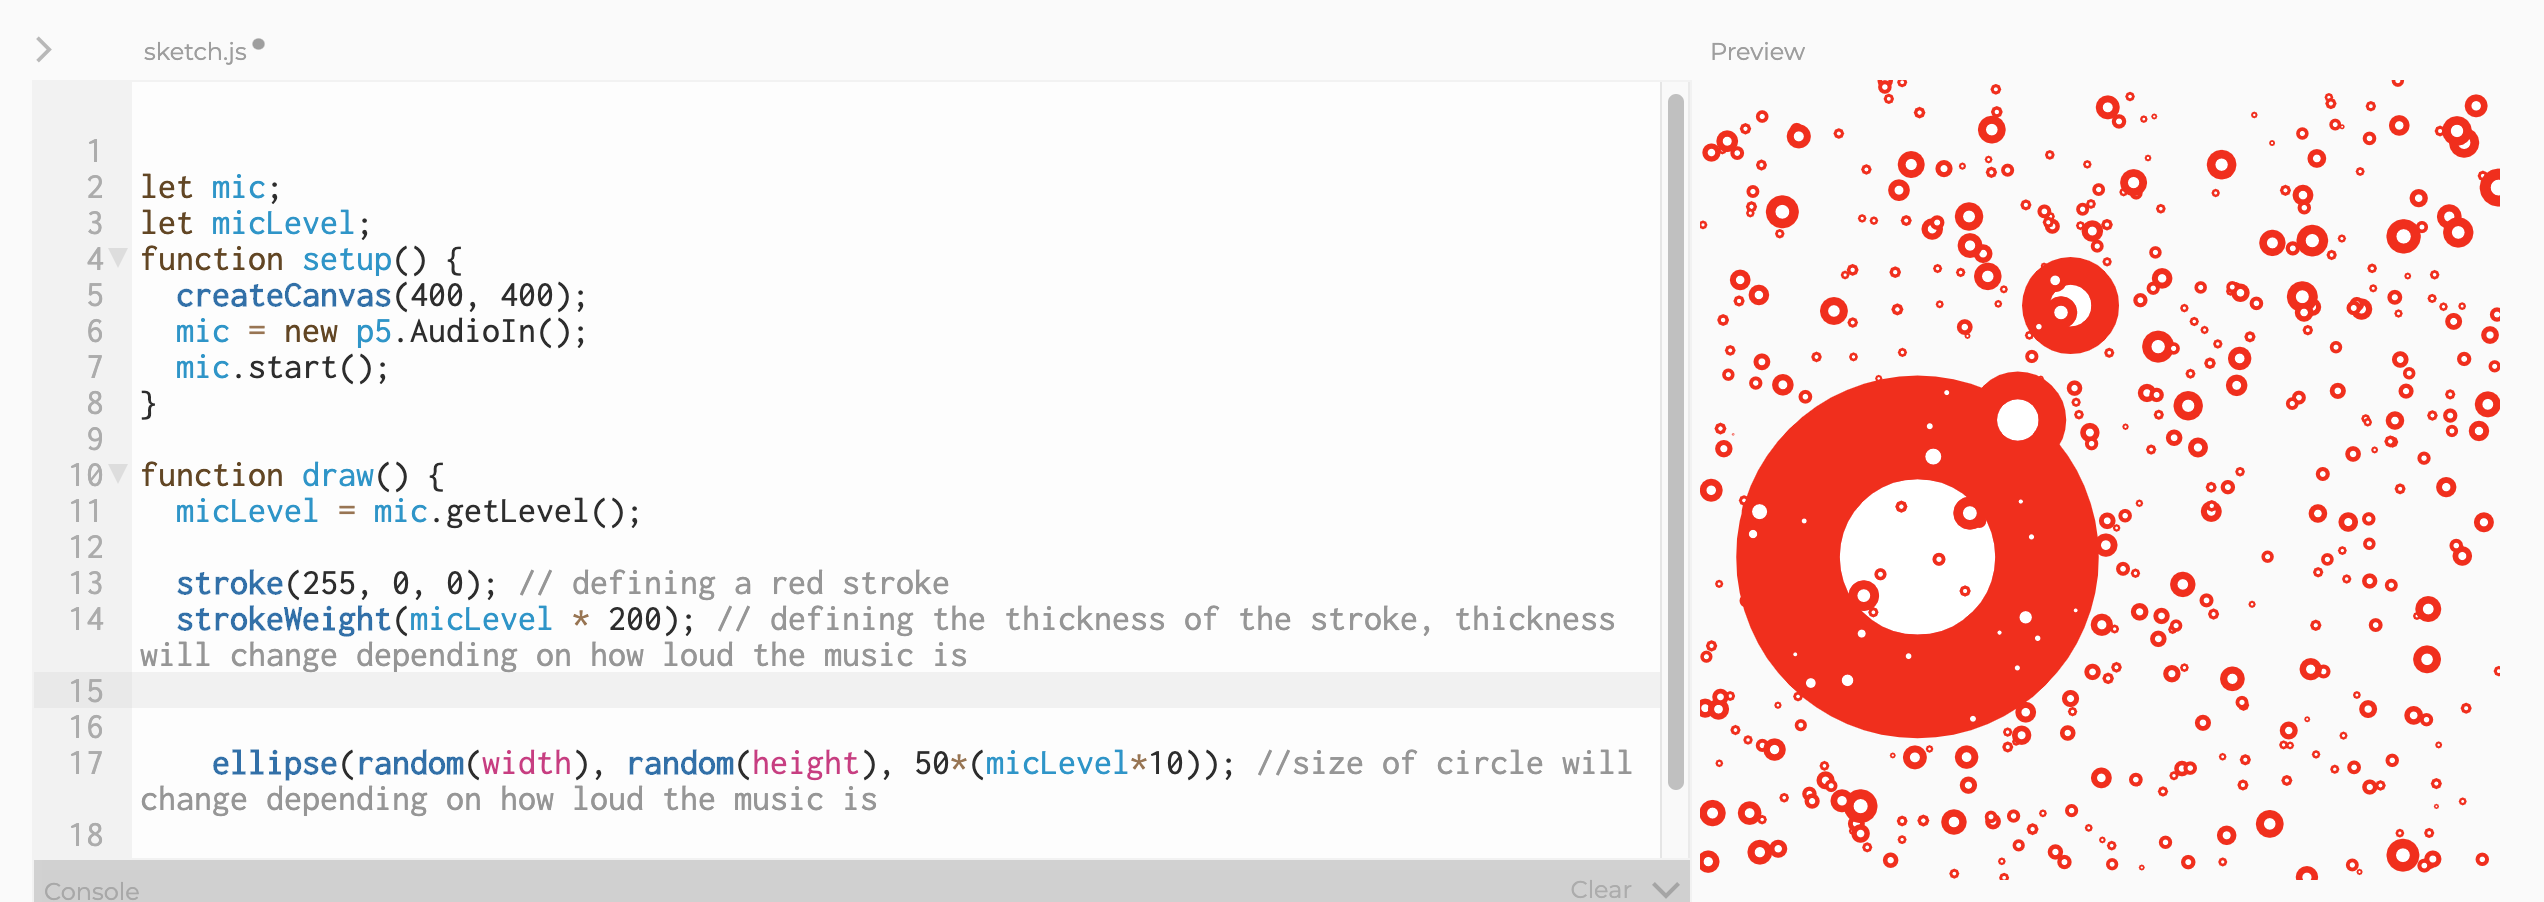
We’re getting really close now. Only a few more steps to go before the finish line. Now that you know your mic is working, you can try passing in the micLevel and playing some music to see how the visualization responds. You can also introduce a few more functions, such as stroke and strokeWidth. The role of stroke is to define the color of the border of your shapes. Like fill, you pass in 3 values for red, green, and blue. On the other hand, strokeWidth is for defining the thickness of the border. You can see an example below integrated with micLevel for some cool effects.

We’re at the final step. It’s going to involve a slightly more complicated programming concept, so bear with me. This concept is called loops, and in particular we are going to use a for loop. Basically you define a variable, like num, and that variable can increase or decrease until you reach a specified stopping point. Most of the time, for loops are used to count upwards by 1 to a designated end point. So a for loop like for(let num=1; num <= 8; num++) { console.log(num) } will output 12345678. Hopefully that makes sense. There is plenty of reading online about for loops if you are still confused.

Unfortunately it doesn’t look that cool in a screenshot. It will look much cooler for you when you actually have the code in P5.js yourself and play some jams! So first, let me put the code here so you can actually copy and paste instead of manually typing everything out. This was the exact code that was written in the original P5.js tutorial.

let mic;
let micLevel;
function setup() {
  createCanvas(400, 400);
  mic = new p5.AudioIn();
  mic.start();
}

function draw() {
  micLevel = mic.getLevel();
  background(5);
  
  stroke(255, round(micLevel * 800), round(micLevel*255));
  strokeWeight(micLevel * 200);

  
  for(let i =0; i < 6; i++) { // for loop counting from 0 to 6 
    fill(random(250), random(100), random(255), 255); //1 circle is drawn with every loop, so 6 circles total
    
    ellipse(i*60 + 40, micLevel*5000 + random(50), 50); //micLevel for the y value caues the circles to go up and down with the volume, i*60 means a new circle is drawn every 60 pixels along the x axis
  }
 
}

I also tweeted out a video of my own code and music so if you don’t feel like it or don’t have time right now to tinker with the code here is a short video. Make sure you turn the sound on!

https://twitter.com/nadyaprimak/status/1246484591004745728

Hope you enjoyed this P5.js tutorial. Stay tuned for another retrospective on SpacyCloud live workshop about the hydra-editor!

If you enjoyed this article, consider following me on Twitter @nadyaprimak or if you need more tips on breaking into the tech industry, you can read my book “Foot in the Door”.